The Beauty and Personal care category of Amazon can be incredibly and competitive. There are thousands of companies competing on the same terms advertising, placements on ads, and attention from customers.
Some sellers think growth only is a matter of increasing the amount spent on advertising. Growth comes via structure, information optimization, well-planned execution.
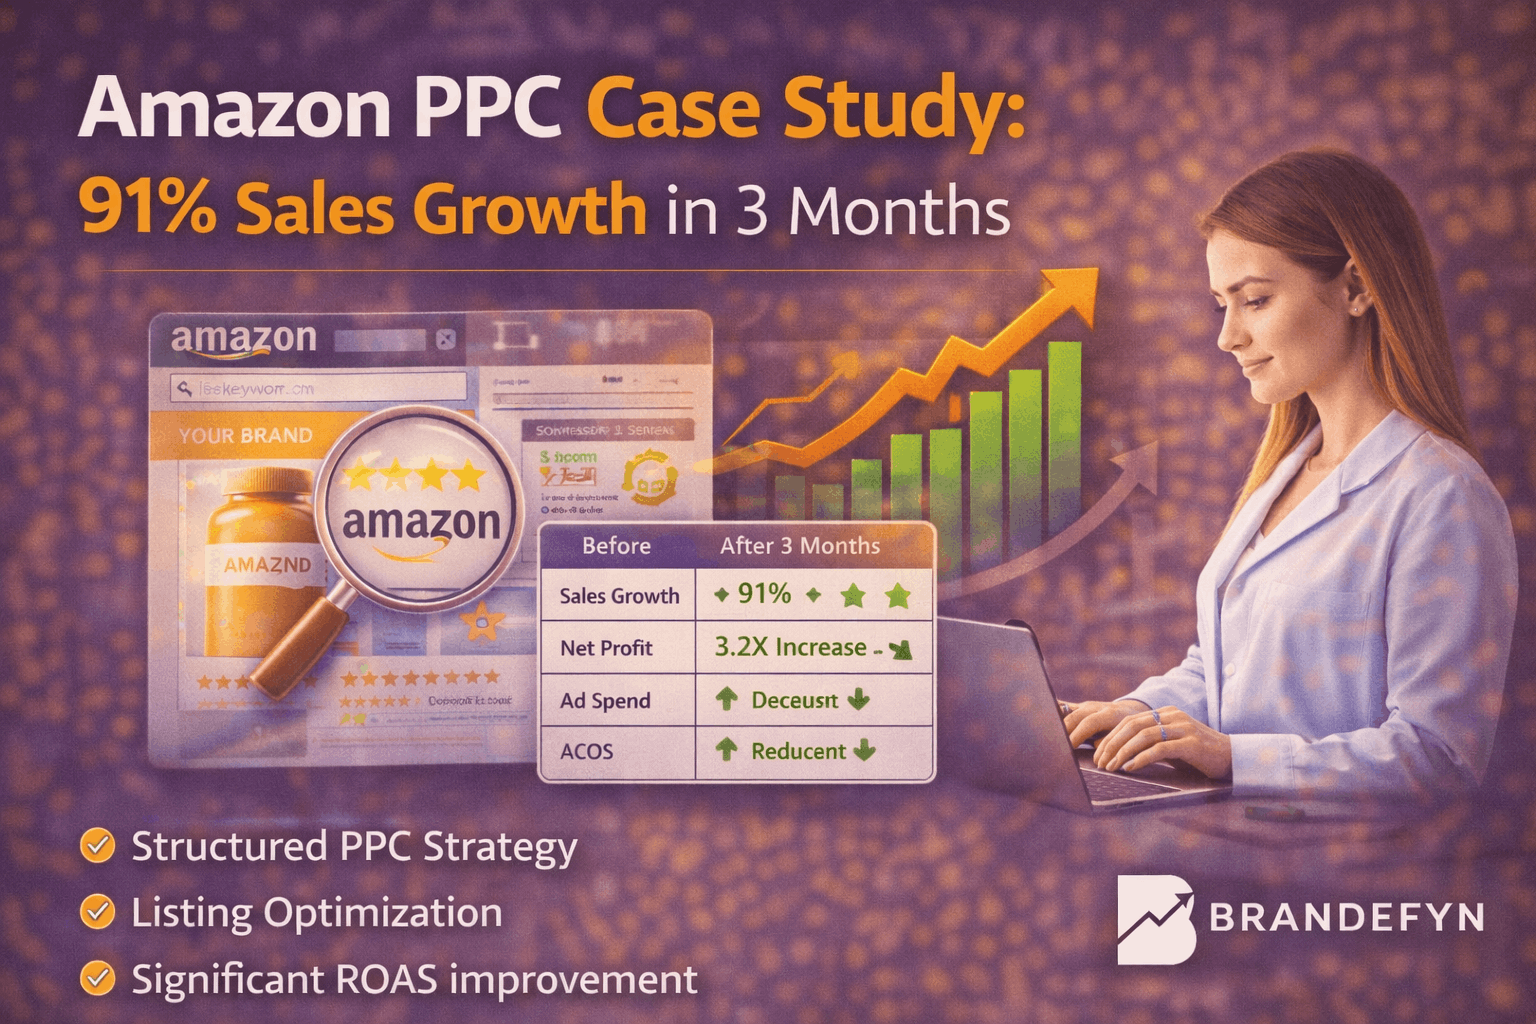
This case study demonstrates how a well-planned PPC strategy, optimization of listings and controllable budget reallocations assisted an Beauty & Personal Care brand grow the number of sales it sold by 91% in less than three months. It also helped in improving the profitability.
This wasn’t random growth. This was engineered.
Brand Case Study
Overview
The company operates within Beauty & Personal Care and joined forces with us to expand their Amazon presence naturally and with advertisements. The primary goal of the brand was to grow sales, cut down on the effectiveness of advertising, and increase profits.
The brand had already items listed, and it was earning income. But, the performance was not consistent advertising was unefficient as well as profit margins were squeezing.
They required a structured expansion, not sporadic growth spurts.
Challenges
Prior to the implementation of our strategy the brand was faced with a number of key challenges:
- Advertising spend is high, but lower return
- Inconsistent monthly revenues
- Low profit margins due excessive ad expenses as well as competition
While traffic was present but conversion rates weren’t adequate to allow for an aggressive scale. Campaigns for advertising were in operation however, keyword selection was lacking the precision needed. The allocation of budgets was not in line with the profit.
As a result, spending increased with no proportional growth in profits.
Our Strategy
- We completed a full restructuring of their advertising and optimizing process.
- The objective was straightforward: enhance efficiency first and after which, scale up economically.
Here is the exact method used.
1. Streamlined Sponsored Products, Sponsored Brands, and Display Campaigns
We rebuilt campaign structure across:
- Sponsored Products
- Sponsored Brands
- Sponsored Display
The campaigns were classified based on the intent, level of performance, as well as the kind of keywords. Keywords that had high-intent were separated from separate campaigns. Discovery campaigns were distinguished from the ranking campaigns.
This gave greater control over budgets and bids.
2. Tightened Keyword Targeting & Aggressive Negative Targeting
The audit of search reports was conducted and found:
- The keywords that have been bled are not converted
- AcoS keywords with high quality. ACoS keywords that require bid refinement
- Inappropriate search terms that waste budget
The campaign employed the most aggressive negative targeting techniques in general and automobile campaign to reduce the waste.
3. Listing Optimization (Images, Title, Bullet Points)
Conversion is not cheap.
We have optimized:
- Product titles for stronger keyword alignment
- Bullet points are used to highlight advantages, not attributes
- Images of the product to enhance the clarity of your product and increase trust
- Visual hierarchy of mobile buyers
Improved listings increased conversion rates. This directly cut down on ACoS.
4. Adjusted Pricing Strategy
- Analysis of pricing trends revealed differences in particular time frames.
- We rearranged pricing so that it remains in the market without harming margins.
- This enabled us to keep our conversion rate during the promotional window.
5. Budget Reallocation Based on ROAS & ACoS
Instead of increasing the total advertising expenditure, we changed the allocation of our budget towards:
- ROAS campaigns with high ROAS campaigns
- Campaigns to rank for key words
- Events and seasonal pushes
Campaigns that were not performing well were cut or suspended.
The margin was preserved while growing output.
6. Strategic Deals During Prime Events
Performance spikes were created through:
- Prime Day alignment
- Window sales
- Events-driven PPC promotes
Instead of running constant discount promotions instead, we made use of promotions to improve the flow of traffic during peak time.
Performance Results
(Monthly Overview – Last 3 Months)
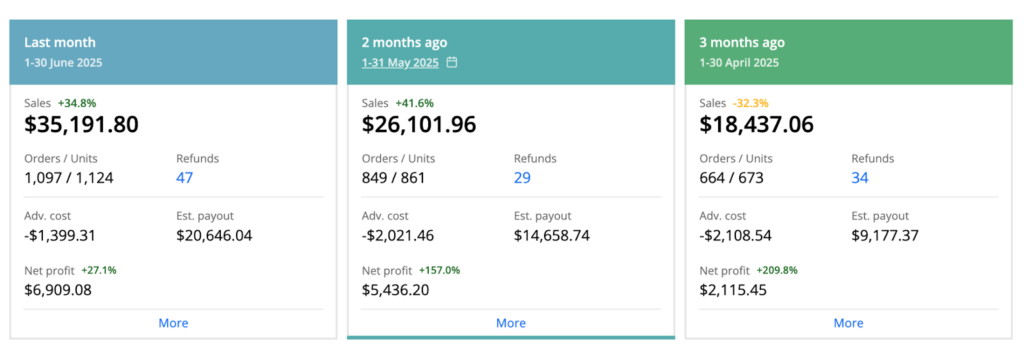
Following restructuring and optimization the results were quantifiable.
- The sales grew by 91% between April through June
- Net profit grew 3.2X as ad spending declined
- The efficiency of advertising improved ACoS decreased substantially
The growth was due to efficiency and not from higher expenditure.
Performance Snapshot Table
| Metric | Before Optimization | After 3 Months |
|---|---|---|
| Monthly Sales | Baseline | +91% Growth |
| Net Profit | Baseline | 3.2X Increase |
| Ad Spend | High | Reduced |
| ACoS | Elevated | Significantly Lower |
| Conversion Rate | Moderate | Improved Trend |
Long-Term Growth Overview
Period: Jan 2024 – July 9, 2025
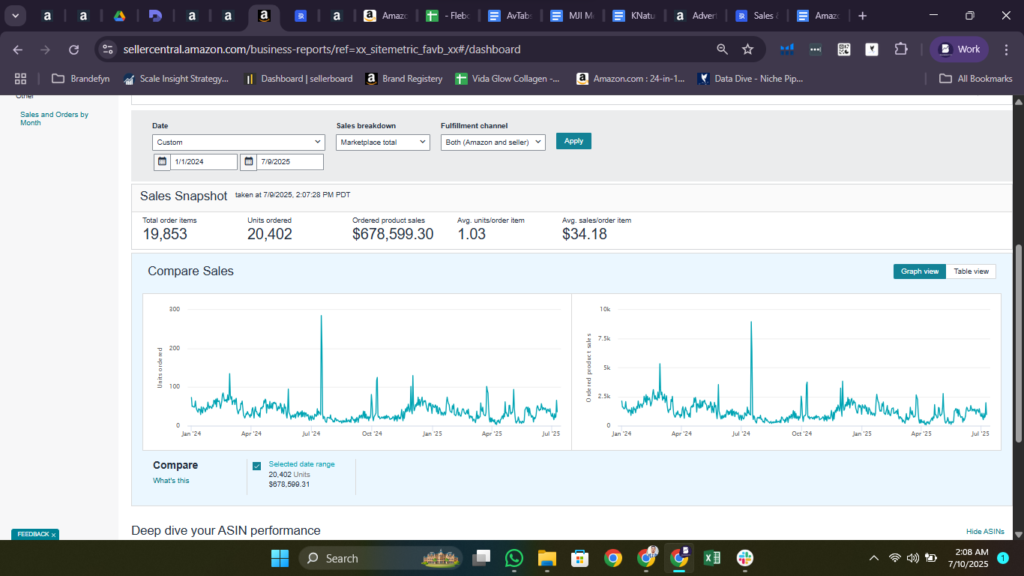
In the span of 1.5 years, this company exceeded $678,000 in the total Amazon sales while exhibiting an increasing conversion rate.
It was not a linear processIt was more strategically planned.
These spikes in performance are associated to:
- Prime Day
- Discount periods
- Structured PPC is a means of pushing
- Listing refinements
- Relocation of budget funds
Organic rankings increased with time, as sales speed increased.
Long-Term Growth Summary Table
| Period | Total Sales | Trend |
|---|---|---|
| Jan 2024 – July 2025 | $678,000+ | Stable Upward Growth |
Why This Strategy Worked
The most important difference was in the structure.
Numerous brands have advertisements. They are not all structured correctly.
The improvement came about because of:
- Precise keyword control
- Strict negative targeting
- Improvements to conversion-focused listings
- Budget discipline
- Reallocation based on performance
- Scaling based on events
Each layer supported the next.
How Advertising Efficiency Improved
An increase in ACoS doesn’t always translate to less quantity.
In this instance:
- ACoS decreased dramatically
- The volume was not diminished.
- Profits increased
- The reduction in spending
This shows that optimization and refinement of targeting can be more effective than spending on budgets.
Conversion as the Growth Multiplier
The improved conversion rate was amplified by every other attempt.
The more listings convert:
- PPC gets less expensive
- Organic rankings improve faster.
- The speed of sales increases
- Profit margin strengthens
Optimization of the listing was not merely cosmetic but was actually driven by performance.
Budget Discipline vs Budget Expansion
Many sellers seek to resolve the problem of growth by increasing advertising spending.
In this instance in this case, we:
- The reduction in wasted spending
- The elimination of words that were not performing.
- Focused on profitable segments
- Budget reallocated, not increased it
The margin was preserved while speeding up expansion.
The Importance of Data-Based Decisions
Weekly optimizations were using:
- Reports of search terms
- ROAS analysis
- ACoS tracker
- Conversion data
- Keyword performance segmentation
The decision wasn’t based on emotion.
Everything was aligned to margin targets.
Structured Growth vs Random Scaling
This example illustrates the differences between
Unstructured Scaling:
- The bids are increasing randomly
- Running constant discounts
- Ignoring negative targeting
- No listing updates
- Budget bleeding
Structured Growth:
- Keyword targeting controlled and controlled
- Bid adjustments systematic
- Improvements to conversion-focused listings
- Strategic events push
- Reallocation of budgets based on profit
The difference can be measured.
Summary
Through an ongoing PPC method, optimization of listings as well as controlled budget reallocation:
- The sales grew by more than 90% over the course of three months.
- Profit grew by 227 percent
- ACoS decreased significantly, while sustaining the volume
- Sales of 678Kplus were made possible by stable trend of growth
This is not just a temporary rise.
It was a well-organized, flexible performance.
Leave a Reply